

TECHNOLOGY
Our game-changing method is based on the big data analysis of satellite radar data. Follow the links or explore below to learn more about our technology and how we can help you.
Quick Links:

APSIS INTERFEROMETRIC SAR
™
Remote interferometric synthetic aperture radar (InSAR) is a cost-effective, wide-area method for measuring subcentimetre rates of surface deformation. This geodetic method utilizes synthetic aperture radar (SAR) data acquired from instruments mounted aboard Earth-orbiting satellites. Ground deformation can then be extracted from engineered differences of phase between pairs of images taken at different periods in time.

Conventional InSAR

APSIS™ InSAR
APSIS™
Advanced Pixel System using Intermittent SBAS
APSIS™ is the next generation of Terra Motion’s award-winning ISBAS (Intermittent Small Baseline Subset) capability. Sensitive to millimetric rates of deformation, it is capable of measuring over the widest range of land cover classes including urban, agriculture, forestry, and natural surfaces.
With APSIS™ we offer:
-
High-resolution maps of land deformation.
-
The maximum possible density of measurements over urban and rural areas alike.
-
Average motion and full time-series measurements resolved into vertical and horizontal components to fit the needs of the user.
-
Low-volume raster files for easy manipulation in open-source and commercial GIS systems.
-
Support for local, regional, and national monitoring solutions.
For larger rates of motion, we also offer an InSAR method that uses interferogram stacking, designed to work best over areas of good and persistent reflectivity.
You can see how the two methods compare below.
Range of Movement & Applicability
APSIS InSAR
Interferogram Stacking
™
Displacement rates less than a few cm/year. All land cover types.
Larger displacement rates of decimetres/year. Works best in areas with persistent reflectivity.
Minimum Number of SAR Images
30
10
Spatial Resolution
Sentinel 1: 20 m or 90 m
(2.5 m resolution can be achieved with high-resolution data)
Sentinel 1: 10 m
(2.5 m resolution can be achieved with high-resolution data)
Maximum Area of a Single Processing
20 m data: 20 km x 25 km
90 m data: 80 km x 80 km
(or equivalent km²)
10 m data: 10 km x 10 km
(or equivalent km²)
Movement Components
1D (Line of Sight) or 2D (Up-Down and East-West) depending on data availability.
Two independent data sets acquired from ascending and descending geometries covering the same time epoch are required for a 2D analysis.
Output Format
Output Products
GeoTiff raster(s) map in an appropriate projection
Average Velocity: A single GeoTIFF quantifying the average rate of motion over the observation period. This is calculated using a linear model of deformation.
Time-series: A stack of N GeoTIFFs, where N is the number of images processed. The files measure the relative height change / cumulative deformation of the surface with respect to the first image. This is calculated using a non-linear model of deformation.

InSAR ANALYTICS
The near complete ground coverage that the APSIS™ InSAR algorithm delivers provides unprecedented insights into surface motion dynamics across wide areas and over long periods of time. Underpinned by an ever-increasing availability of data from new SAR missions, manual analysis of such a volume of information in space and time can be limiting. Manual interpretation of time-series can be tedious, time-consuming and subjective. To derive meaningful and actionable insight from ‘big EO’ data, Terra Motion Canada has developed analytical tools to objectively screen the data to recognize trends and identify where change has occurred.
HOTSPOT ANALYSIS
Phenomena which cause ground movements frequently result in spatially correlated subsidence or uplift. Spatially correlated movement is more likely to be a result of the underlying process as opposed to noise which could be interpreted as a ‘false positive’. The hotspot analysis objectively identifies areas of statistically significant clusters deformation. The algorithm evaluates each deformation feature within the context of neighbouring features. This determines if the spatial clustering of the

observed motion is greater than would be expected if underlying spatial processes were truly random. To be statistically significant, a feature must have a high or low value and be surrounded by other features with a similarly high or low values.
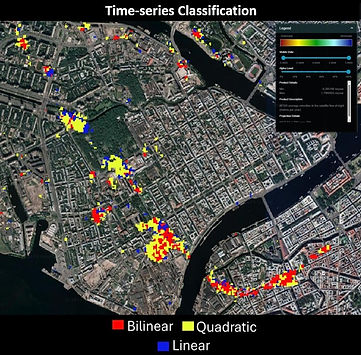
TIME-SERIES CLASSIFICATION
The time-series classification categorizes each pixel based upon the temporal profile of the time-series. It is based upon a series of statistical tests and a decision tree to determine whether the pixel exhibits a stable, linear, bilinear, quadratic, discontinuous or seasonal trend. The classification algorithm provides greater insight into the nature of the deformation signal, without requiring manual and subjective analysis of millions of time-series.
TIME-SERIES CHANGE POINT DETECTION
The time-series change point detection identifies the probability of an underlying state change in each measurement of the time-series. Focusing on statistically significant changes in the deformation signal helps to filter out noise. It assists in identifying the exact moment when deformation behavior shifts, helping pinpoint when, for example, tunnelling or mining activities begin or intensify. The change point detection algorithm can support
alerts, based upon defined thresholds, for monitoring programs where a site is repeatedly surveyed with the latest available imagery.

SAR CHANGE DETECTION
Synthetic Aperture Radar utilizes radar signals to generate high-resolution images of the Earth. SAR systems are often mounted aboard satellites, sending out microwave pulses which bounce off the surface and return to the sensor. SAR is, therefore, an active system which is unaffected by illumination conditions and can penetrate through cloud cover and vegetation canopies to map underlying changes. Uniquely, this makes SAR change detection a reliable and global surveillance tool which can operate in regions where optical systems fail. SAR change detection is used for many applications including environmental monitoring, disaster response, agriculture and defence. For many use-cases, SAR change detection measurements reinforce or supplement the insights provided by APSIS™ InSAR.
Amplitude & Coherence
SAR amplitude measures the brightness or intensity of the reflected signal. The intensity is primarily a function of the surface characteristics such as the material properties of the target, moisture content and roughness. SAR amplitude facilitates the characterization of the presence or absence of surface objects, soil moisture, vegetation and surface roughness. SAR coherence measures the phase consistency between images. By deriving the coherence between consecutive sequential images, SAR coherence facilitates the characterization of surface activity. Coherence is usually maintained over short periods of time; therefore, the loss of coherence can be indicative of surface activities.

Polarimetry
SAR signals are transmitted and received in different polarizations (i.e. the geometric planes in which their electrical field is oscillating). When a polarized electromagnetic wave interacts with a target, the target changes the polarization state of the scattered wave. The nature of the depolarization depends on the properties of the target, including shape, structure, orientation, dielectric constant and roughness. SAR Polarimetry analyzes the polarization state of electromagnetic waves to extract information about surfaces and objects. Terra Motion Canada have developed workflows to provide change detection information on shape & structure and surface roughness.
SHAPE & STRUCTURE
The shape and structure product determines whether the dominant scatterer is characterized as either dihedral, volume, or surface. A dihedral scatterer defines a particular right-angle shape and would therefore indicate the presence of a building or vehicle. Volume scattering would be typical of vegetated areas with more random scattering taking place within the structure of a forest, crop or grassland. Surface scattering would be observed over bare ground surfaces.

SURFACE ROUGHNESS
The surface roughness product quantifies the Entropy, Anisotropy, and Alpha angle of the scattering. Entropy describes the randomness of the scattering, enabling distinction to be made between highly specular reflections over smooth surfaces, versus rough surfaces where scattering is more unpredictable. Anisotropy is a measure of the preferred direction of the scattering and is perhaps best imagined as the inverse of an isotopic scatterer where generally the target scatters equally in all directions. Alpha measures the angular preference of scattering.